Referrers: Search Engines
Guide for:


This report shows the number of visits to your site coming from the search engines.
The first table shows the number of search engines listed underneath and the number of visits from the listed search engines.
Filters
- Calendar: it allows you to select the time interval for which you want to analyse the traffic data. For more info, click here.
Pie chart - Composition percentage
The pie chart shows the percentage composition of visits according to the origin from the different search engines.
Stacked bar chart
The stacked bar chart shows the composition in absolute values of the visits according to the origin from the different search engines (represented with different colors).
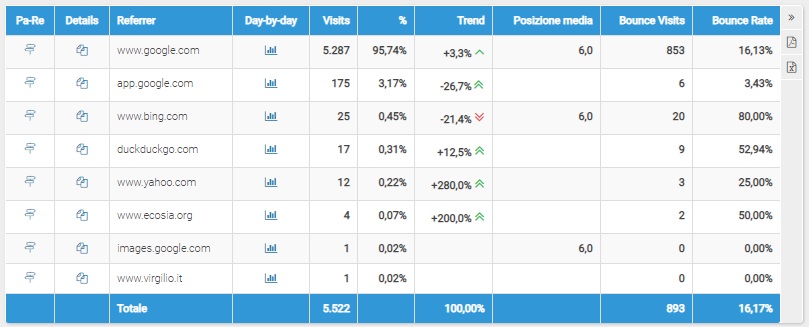
Table
Each table row shows the following data:
- the search engine
- the number of visits from the specific search engines
- the percentage on the total visits coming from search engines
- the trend
- the average ranking of your site on the corresponding search engine
- the Bounces (*): the number of times when the landing page was the only page viewed during a visit, that is the number of visits by browsers coming from the search engine under examination, that entered the site, viewed a single page and exited the website
- the Bounce Rate (*): it shows the percent of visits, coming from the search engine under examination, consisting of a single page view out of the total visits coming from this search engine
The "Average Ranking" column, available in ShinyStat Business only, shows your site average ranking in the search engines in relation to the search keywords measured by ShinyStat.
Search Engines & SERD™ (ShinyStat Business only)
The Search Keywords report shows the powerful features of the SERD™, a system developed by ShinyStat to measure the ranking of a web site on the major search engines. It indicates the average ranking of your site on each search engine in relation to the total keywords searched on it.
The SERD™ is available for the major search engines.
Campaign Conversions
In order to properly measure the visits coming from sponsored links and their conversions, please use the Campaign Conversions feature.
Total
For easier reading, the last row in the list shows the total listed values.
Bounce Rate (*)
The Bounce Rate, in connection with a traffic source, helps you in understanding the possible reactions of users when arriving on your site from a specific search engine or keyword, from a given web page or from a particular campaign (banner, mail, link, or Pay Per Click).
A high Bounce Rate could be due to a gap between the landing page and the expectations that an ad in the site, in a search engine or in a promotional campaign has generated in the user.
The Pages report (Pages) lets you see in detail which pages have a higher "Bounce Rate" for a specific source, providing you with a useful set of statistics to figure out what are the problems for your visitors and optimize your investment.
For more information about Bounces, please take a look at the page called: Bounces - Bounce Rate
(*) Bounces and Bounce Rate are available in ShinyStat Pro and ShinyStat Business version since July 2010.
Campaigns
Traffic data from links configured as Google Analytics Campaign are displayed in the "Campaign Referers" report regardless of the traffic source in which the link was clicked (since 14th December 2017).
For further information, please contact the ShinyStat Support Centre