ShinyStat™ Debug - Misc
Guide for:

The report entitled "Misc" offers an overview of the debug signals sorted by volumes, i.e. the amount of error signals received in the selected time interval.
At the top of the page is a bar chart, that shows the number of signals received from browsers, separated by day, pointing out the presence of unexpected errors or events in the execution of the web page code.
Errors can be generated in various contexts:
- during the execution of the javascript code
- in the interpretation of the html code
- or in retrieving the resources needed to display the page.
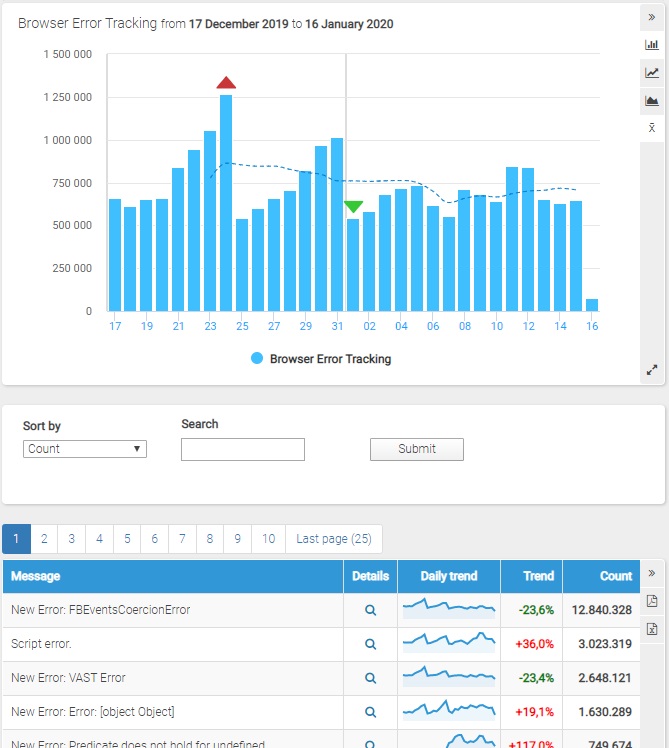
It is possible to change the type of graph by clicking on the icon on the right (bar, line and area graphs).
For periods that include at least 8 days, by clicking on the "Show/hide mobile average" icon, you can respectively show or hide the mobile average, displayed with a dotted line.
The table shows the list of types of errors that occurred in the selected interval (based on the message).
By moving the mouse over the small graph in the "Daily trend" column, it is possible to view the amount of errors encountered in each single day.
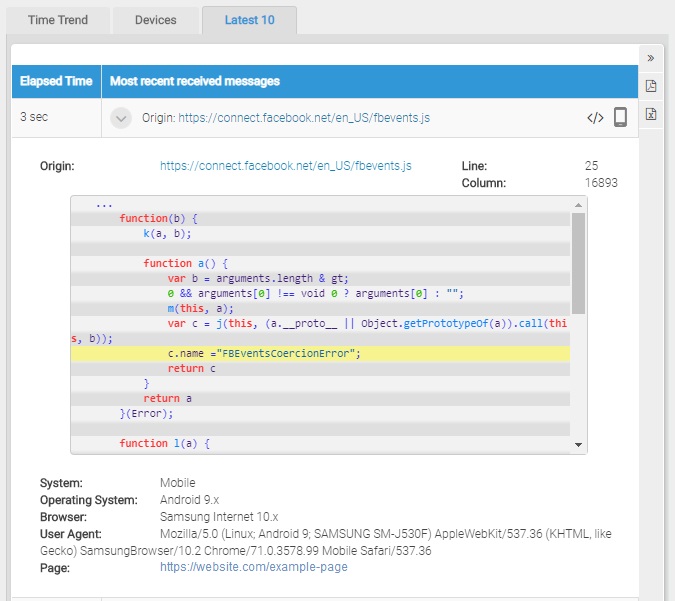
By clicking on the "Details" icon for each row of the table, you will access the detailed report that shows the information collected for the selected error message:
- the daily (and hourly) trend of volumes
- the distribution of the platforms and browsers from which it was generated
- the latest 10 messages received
The available filters allow an intelligent grouping of the errors, that is useful for identifying problems at a glance so as to solve them even before they have any impact on web browsing.
- Sort by: allows you to sort the data based on the total amount of signals received or based on a computed index that expresses the increase in volumes over time
- Search: allows you to filter the data showing only those related to the error messages corresponding to the search input