ShinyStat™ Debug - Browsers


The "Browsers" report shows the distribution of signals based on the browser and related daily volumes.
The analysis of this kind of information allows to quickly guess the occurrence of issues depending on specific browsers, allowing to focus the attention on that part of collected data.
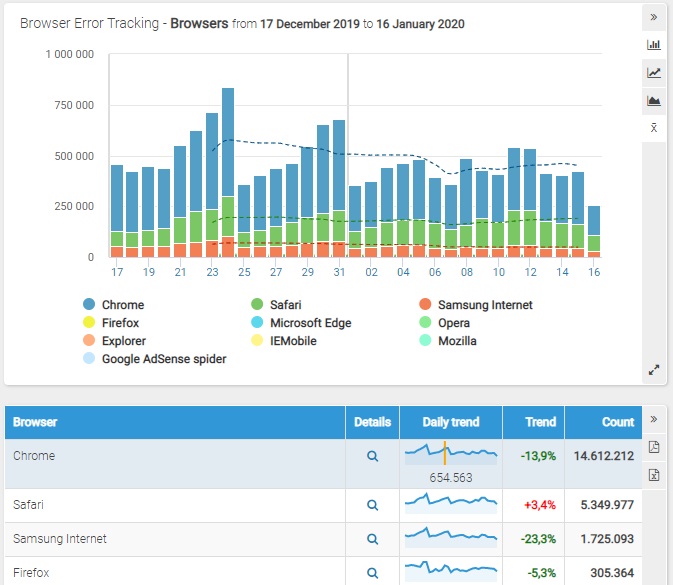
The bar graph shows the daily amount of received signals, highlighting with different colors the operating systems installed on the source. It is possible to change the type of graph by clicking on the icon on the right (bar, line and area graphs).
For periods that include at least 8 days, by clicking on the "Show/hide mobile average" icon, you can respectively show or hide the mobile average, displayed with a dotted line.
Each line of the table shows the following information:
- Browser: indicates the type of examined browser
- Details: by clicking on this icon, it is possible to access the detailed report for the corresponding browser
- Daily Trend: by moving the mouse pointer over the small graph, you can see the amount of errors collected in each single day for the browser under consideration
- Trend: it indicates the percentage variation of collected signals in the second part (the last quarter) of the selected period compared to those received before
- Count: indicates the total number of signals received for the type of device under consideration in the selected period
By clicking on the "Details" icon for each browser, you will access the detailed report that shows the measured data for the selected type:
- Message: list of error messages generated by the selected browser
- Details: by clicking on the "Details" icon, you can access another report page where detailed information refer to the message and browser chosen (the page is similar to the one inside the section "Misc", but containing only the data of the selected browser)
- Daily trend: by moving the mouse on the corresponding icon, it is possible to view the quantity of signals received for the selected message on each single day
- Trend: it indicates the percentage variation of signals collected in the second part (the last quarter) of the selected period compared to those received in the first part
- Count: indicates the total number of signals received for the message under consideration in the selected period.
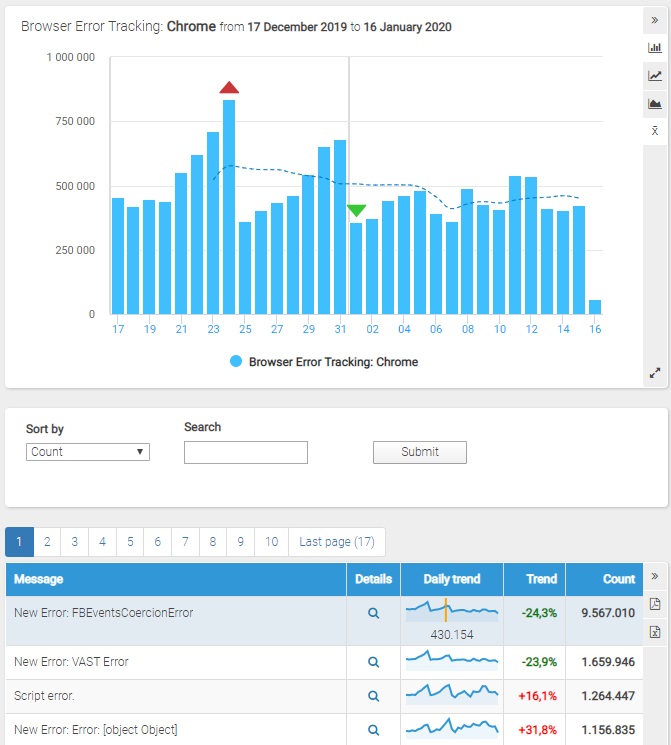
The available filters allow an intelligent grouping of the errors, that is useful to quickly identify any problems and resolve them before they have any impact on web browsing:
- Sort by: this feature allows you to sort the data in the underneath table by the selected option (by the total number of signals received or the volume variation).
Sorting based on the index of changes in volumes allows you to display first the messages for which the greatest increases have recently been reported. - Search: this option allows you to filter the data showing only those related to the error messages corresponding to the search input