ShinyStat™ Debug - Latest 25 messages
Guide for:


The report page “ShinyStat™ Debug – Latest 25" contains the list of the 25 most recent exception messages received, including the indication of the elapsed time.
All the time indications refer to the instant the report page was loaded.
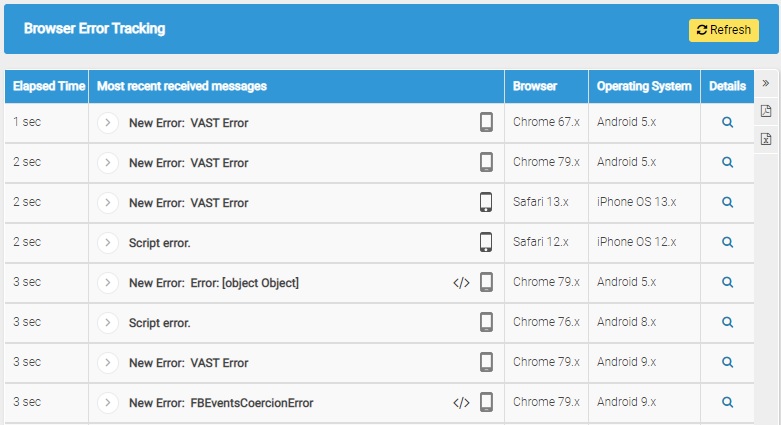
Each line provides the following information:
- Elapsed time: indicates the time in which the error occurred
- Message received: shows the error message
- Device: the icon indicates the type of device (desktop, mobile, console, bot) on which the error occurred
- Browser: indicates the browser version generating the message
- Operating system: specifies the version of the operating system on which it occurred
To see the details of the received exception messages, click on the ">" symbol located before the message.
Then, the table row will be expanded showing additional information about the origin and other details of the system.
If available, the box with the source code will also appear, highlighting the point where the currently examined signal was generated.
You can also access the report page that shows the statistics of all the received signals with the same message, by clicking on the symbol
 indicates that in the expansion of the row containing the additional information, reachable by clicking the ">" button, there is an extract of the source code, where the warning signal was generated.
 If the available information makes it possible, the specific code line is also highlighted.