ShinyStat™ Debug - Operating Systems - Details
Guide for:

This report (“Debug > Operating Systems > Details”) shows the amount of error signals received in the selected time interval for the operating system under consideration.
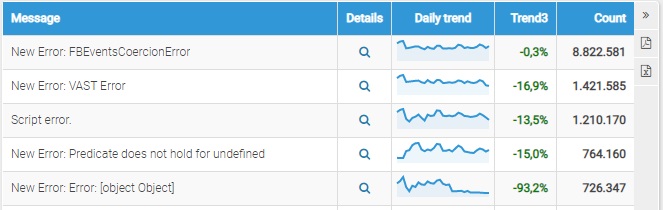
The table shows the list of types of errors that occurred for the specific operating system, providing the following information for each message:
- Message: list of error messages generated by the selected operating system
- Details: by clicking on the "Details" icon, you can access another report page where detailed information refer to the message and operating system chosen
- Daily trend: by moving the mouse on the corresponding icon, it is possible to view the quantity of signals received for the selected message on each single day
- Trend: it indicates the percentage variation of signals collected in the second part (the last quarter) of the selected period compared to those received in the first part
- Count: indicates the total number of signals received for the message under consideration in the selected period.
By clicking on the "Details" icon for each row of the table, you will access the detailed report that shows the information collected for the selected error message:
- the daily (and hourly) trend of volumes
- the distribution for devices, operating systems and browsers from which it was generated
- the latest 10 messages received
- Sort by: allows you to sort the data based on the total amount of signals received or based on a computed index that expresses the increase in volumes over time
- Search: allows you to filter the data showing only those related to the error messages corresponding to the search input