Traffic - Bounces - Report Description
Guide for:

This report shows the trend of the Bounce Visits and the Bounce Rate to your site during the selected time interval.
Summary
The first table shows the following data:
- Bounces: the number of visits by browsers that entered the site, viewed a single page and exited the website
- Bounces Daily Average: it shows the Bounces daily average
- Bounces Trend: the Bounces trend expressed as a percent. In particular, it shows the percentage variation of the bounces during the second half of a given period compared with the total of the first half of the period itself.
Filters
- Calendar: it allows you to select the time interval for which you want to analyse the traffic data. For more info, click here.
- Compare with: thanks to this feature you can compare up to three values selected among the available options.
The "Compare with" feature is available for all the intervals only if you have the ShinyStat Business version; in the other versions it is available only for the 'Latest 31 days' interval. - Compare periods: this feature allows you to select different periods and compare data.
Chart
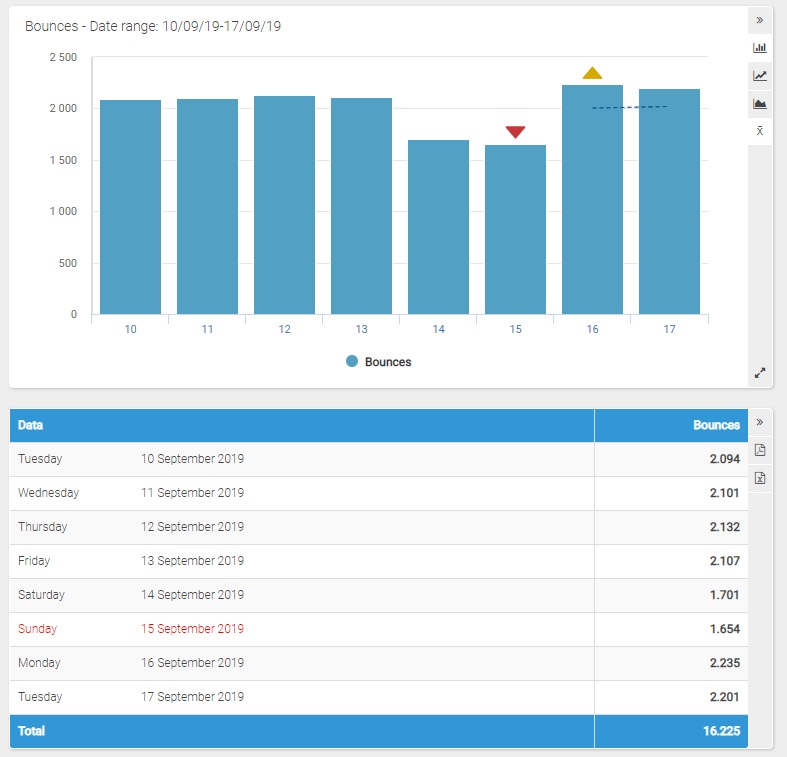
On its horizontal axis, the chart shows the days or the months of the represented period and, on the vertical axis, the Bounce Visits.
It is possible to change the type of graph by clicking on the icon on the right (bar, line and area graphs).
For periods that include at least 8 days, by clicking on the "Show/hide mobile average" icon, you can respectively show or hide the mobile average, displayed with a dotted line.
Selecting a period that includes today and no longer than 122 days, the real time data and the daily forecast for the current day are represented in different colors.
Table
The table shows the number of Bounce Visits day by day. In every line of the table you will find the following data for the selected time period:
- Bounces: the number of visits by browsers that entered the site, viewed a single page and exited the website
For periods that include more than 122 days, the data are represented on a monthly basis rather than daily and the last two columns show the percentage of variation with reference to the previous month (in the first column) and with respect to the same month of the previous year (in the second).
Clicking on the name of each month you can view the daily details.
Selecting a period that includes today and no longer than 122 days, the last two lines of the table show real time data and the daily forecast for the current day.
Bounces and Bounce Rate are available only in ShinyStat Pro and ShinyStat Business version
For more information about Bounces, please take a look at the page called: Bounces - Bounce Rate
Attention! Bounces and Bounce Rate are available since July 2010.