ShinyStat™ Video Analytics - Viewing details for each video - Trend - Chart
Guide for:

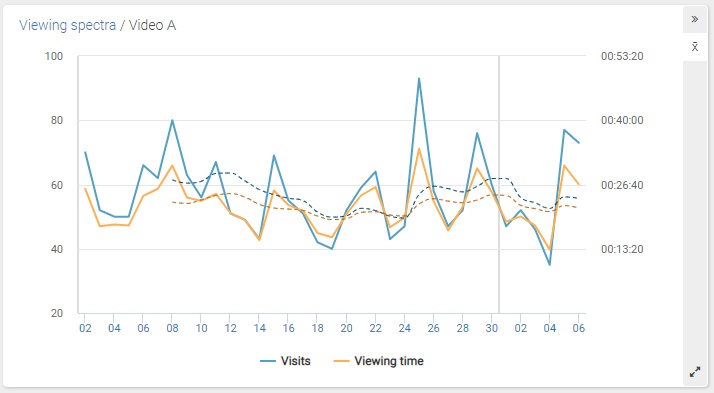
Chart - Viewing data for this video
This chart shows immediately the viewing trend, the highs and the lows for this video in the given time period.
In detail, the chart shows on the horizontal axis the days or months for the given time period and on the vertical axis the number of views and the viewing time for this video, regardless of its position or the web page where the video was viewed.
Blue marks the views, orange the viewing time, given in hours, minutes and seconds (hh:mm:ss).
The chart type can be changed by clicking the icons on the right, by the title.