ShinyStat™ Video Analytics - Viewing details for each video - Viewing Spectrum
Guide for:

Viewing Spectrum for this Video
To analyze in detail the viewers' interaction with this video, the suite ShinyStat™ Video Analytics provides you with a tool called Viewing Spectrum.
This is quite useful for a quantitative analysis of the viewers' behavior and it specifically makes it possible to determine whether there was a "non linear viewing" of the video and also to pinpoint those segments that brought the viewing to a halt.
The report shows:
- Video preview - clicking on the image, the command Play is activated and the video starts
- Percentage of video completion - it shows the relationship between the number of "Absolute unique visitors" and "Absolute unique visitors that completed the video", by viewing at least 90 percent of the video.
- Command buttons for video playing - you can view immediately the scenes that you want to analyze
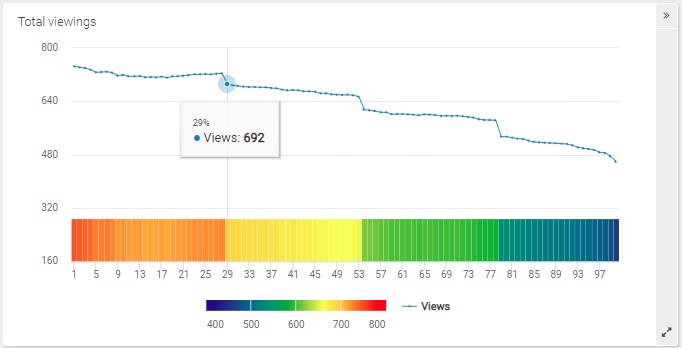
- Viewing Spectrum - it shows the number of viewings for each specific segment of the video
- Color code - it shows the meaning of the different colors in use, from blue for the minimum value to red for the maximum value.
To check the scenes that these views make reference to, you can start playing the video where the segment you wish to analyze begins.
This function provides you with an easier approach to the data, allowing you to see again in detail those scenes that generated a greater or a smaller interest, ie. the scenes that have been viewed several times and those that have been discarded.