User Interaction Analytics - Click Heatmap - Pages with Clicks


The List of Clicked Pages report shows the list of URLs of the pages on which clicks have been made.
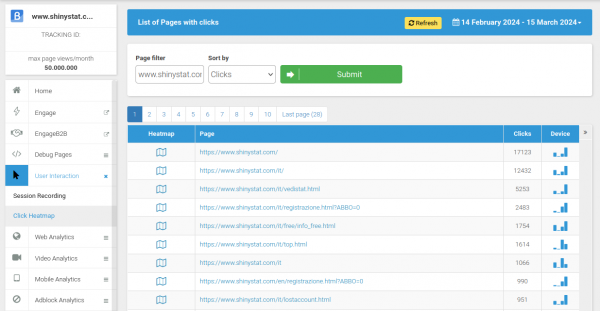
By pressing the icon in the first column, the heatmap of the page is loaded, to observe in which areas the user has focused his attention and clicked and which are the most selected elements of the pages.
The table shows the page URL, the total number of clicks made by users in the chosen day range and the breakdown of clicks based on the device in the small graph in the last column.
By clicking on the Heatmap icon in the first column, discover the details of the selected row by viewing the page and the overlaid map which indicates, in colour, the most clicked area.
The available filters allow you to select the URLs of the pages that match the expression (regular expression) inserted in the field, to display only the pages of a certain area of the site or specific pages.
The sort selector allows you to sort the table rows based on the number of total clicks made in the chosen day interval, to display the pages with the most clicks in the first rows of the table. It is also possible to show the rows of the table based on the alphabetical order of the URLs.