Systems - Resolutions
Guide for:


When is convenient optimize the resolution of your website?
In the "Resolutions" report, visits to the site are classified according to the resolutions of the monitors used by visitors.
Summary
The above table shows the following data for the examined period:
- the number of listed resolutions, ie the total number of the different resolutions used to access to the site
- the number of total visits, ie the number of visits received by the total resolutions
- Calendar: it allows you to select the time interval for which you want to analyse the traffic data. For more info, click here.
- Aspect ratio: allows to filter the data according to those available (all 4: 3, 16: 9 or 21: 9)
- Resolution: The system allows you to filter visits depending on the resolution, too.
- Order by: Select how the resolution listed in the table shall be sorted.
- Devices: It filters the listed resolutions to those received from the selected class of devices.
- Intervals or ranges can be entered with the following syntax:
n Resolution
n.n- Resolutions larger or equal to
n.-n Resolutions smaller or equal to
n.n-m Resolutions between n and m.
The pie chart showing percentage distribution of visits from different resolutions over the period.
XY chart
Displays an overall distribution of the browser's resolution.
Each "bubble" is positioned according to the width and height of the screen od the device.
The area of the bubble is porortional to the number ov visits.
The chart may be zoomed in by selecting a rectangle with the mouse.
The button "Reset zoom" zooms the chart out enough to make all resolutions visible.
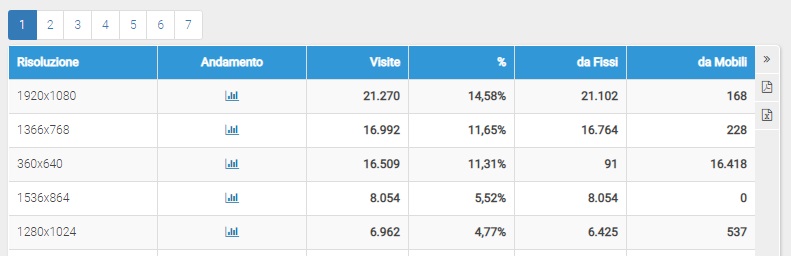
Table
Each row of the table shows the following data:
- Resolution: indicates the resolution of the monitor used by visitors
- Visits is the total number of visits made using the resolution examined
- Percentage (%): the percentage of visits using the resolution under consideration, over the total
Please note
* Data on resolutions are available from January 1, 2015.
The metrics obtained by selecting time intervals spread over this date can not be considered uniform.