
In the modern digital world, investing in tools and instruments that ensure the best user experience is essential for an effective communication and the success of any business.
Only the analysis of user behavior and the study of the website elements that capture attention provide the right feedback to improve the navigation and achieve business objectives.
An easy access to the most popular information and products improves user experience and satisfaction.
After the presentation of the tool Session Recording, that replays a user’s navigation on the webpages, like in a video, let’s see now the new Heatmaps.
What are Click Heatmaps?
Heatmaps are simple and intuitive graphic representations of user interactions with the website, showing which are the “hottest”, or most clicked, areas of a page.
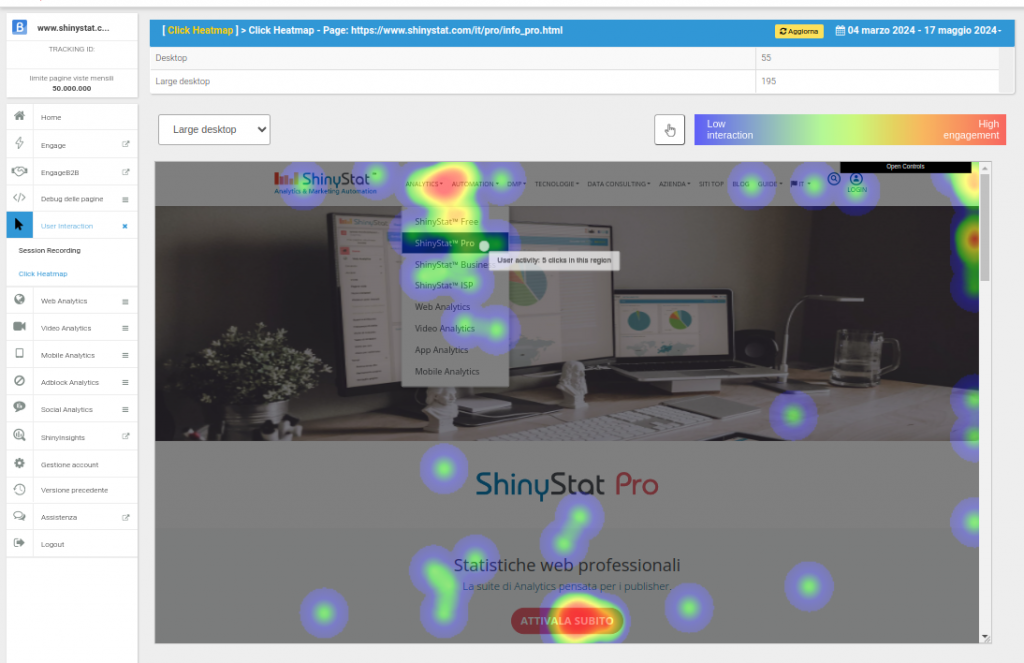
These maps provide valuable insights into user behavior to understand the effectiveness of website elements. For example:
- if users click an image, it is appropriate to add a link to a page related to the topic
- if the help buttons are frequently clicked, the content should be reviewed to avoid confusion
- if some important buttons are ignored, they should be placed in a more strategic position
Mobile and desktop heatmaps
A responsive website, which automatically adapts content to the device, is today a fundamental requirement to reach all users and to follow guidelines established by search engines.
However, the position of the webpage elements can vary substantially based on the screen resolution. It is therefore important to optimize the content by evaluating the effectiveness of the presentation for different devices.
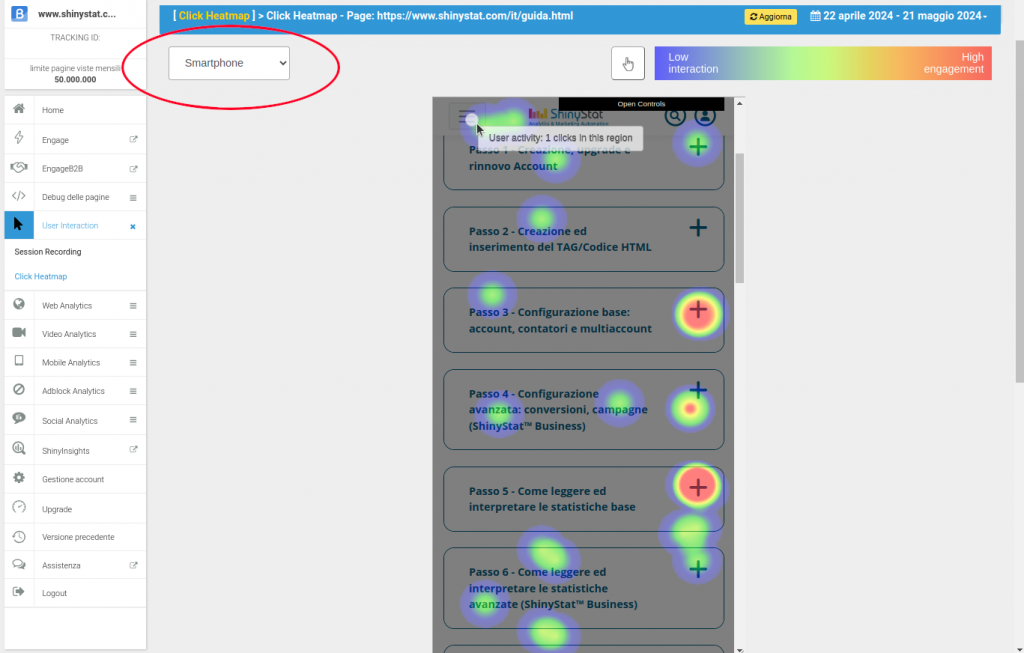
The Heatmap tool displays separately the clicks (taps for mobile) made on different versions of the pages, by selecting from the drop-down menu: smartphone, tablet, desktop or large desktop.
Interaction with the web page
Modern web pages are dynamic, with content varying not only by device, but also by user behavior, for example a drop-down menu can expand to show more details.
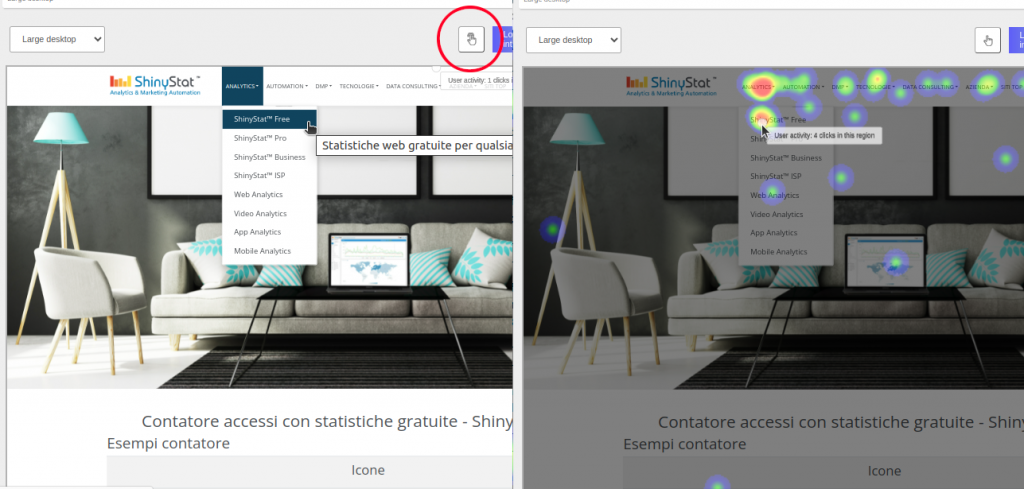
To view dynamic elements on the Heatmaps, there is a button to temporarily disable the layer of the colored areas of the clicks.
As in the example in the figure, you can then click the menu on the website page and view the drop-down menu to understand the interactions carried out by users in that area.
Detail or aggregation?
Each Heatmap contains an options panel, from which you can set the size of the circles and the gradient effect.
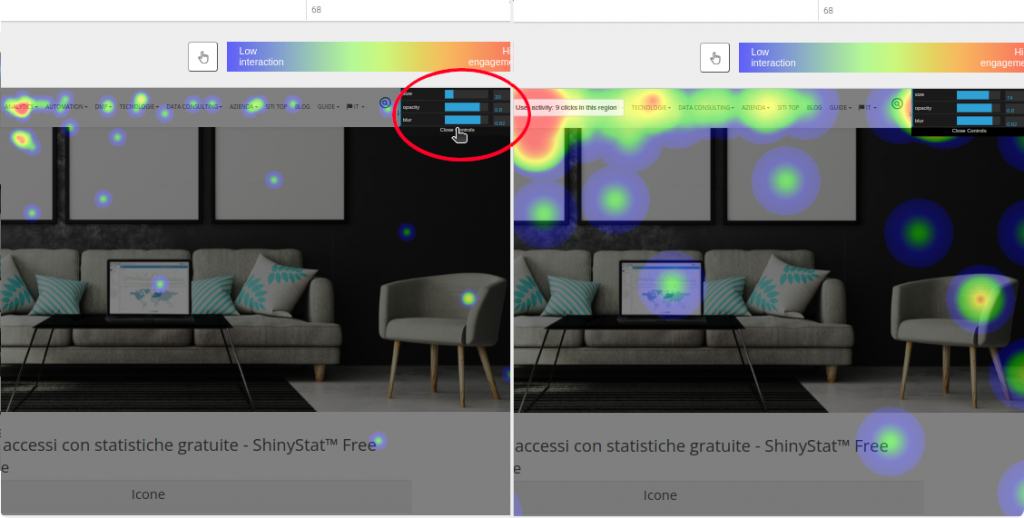
Find the best value for these parameters is particularly useful when the clicks on the page represent a few scattered points, to easily show where the most of the clicks are located, as in the example in the figure.
For further information, the dedicated section of the guide is available.
While for more information and to request the activation of the tool Heatmaps, fill out the form.