
Due to the growing usage of adblock, publishers have the need to know how many visitors are blocking ads with an adblocker in order to analyze the impact on their website and measure their adblock losses.
Adblock is the popular browser extension against ads used by millions of users worldwide. The interests are opposed: on the one hand, it is the software preferred by users who want to block all ads; on the other hand, it is the most feared tool for Publishers losing the chance to monetize a more or less relevant part of their traffic.
But how many are visitors using an adblocker? How many visits or page views? Is adblock used more on desktop or mobile devices? More on smartphone or tablet? And above all: what is the loss in terms of revenue?
ShinyStat™ Adblock Analytics is the new tool to analyse the traffic received from users with adblock and to help publishers understand how much revenue they are losing.
Thanks to ShinyStat™ Adblock Analytics you can evaluate the repercussions generated by adblock usage on your site.
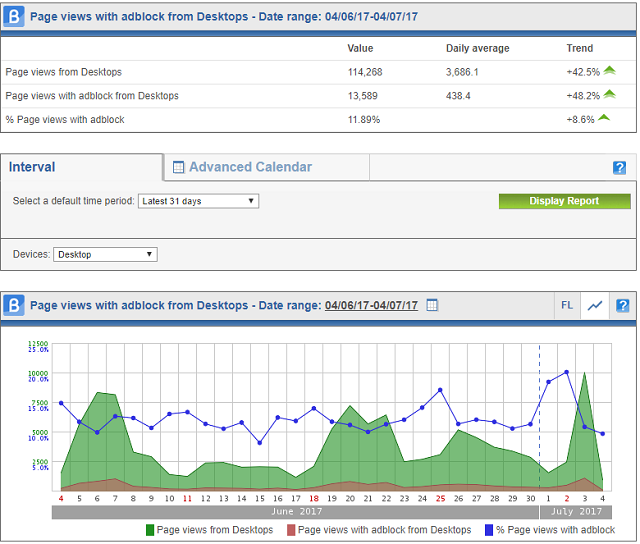
The new reports included in the “ShinyStat Adblock Analytics” section enable you to get an overview of the traffic received by visitors with adblock, providing details about this subset of users depending on the device (desktop, mobile, tablet, smartphone).
ShinyStat™ Adblock Analytics does not require any configuration. It is available in ShinyStat™ Pro and Business versions and it provides a summary of all the basic information, offering the following reports:
- Page views with Adblock
- Visits with Adblock
- New visitors with Adblock
- Monthly unique visitors with Adblock
- Weekly unique visitors with Adblock
- Daily unique visitors with Adblock
For each of listed metrics, the corresponding report shows data according to the device used by visitors:
– Overall data (regardless of the used device, both mobile and desktop)
– Data from desktop devices
– Data from mobile devices
– Data from tablet
– Data from smartphones
If you already have a ShinyStat™ account, click here to see the new report .
If you don’t use the service yet, click here to try the ShinyStat™ Demo Business Version or click here to create a ShinyStat™ Free account.
For any comments and suggestions, please contact the ShinyStat™ Support Center .