ShinyStat™ Video Analytics - Global viewing data - Chart
Guide for:

Chart - Global viewing data
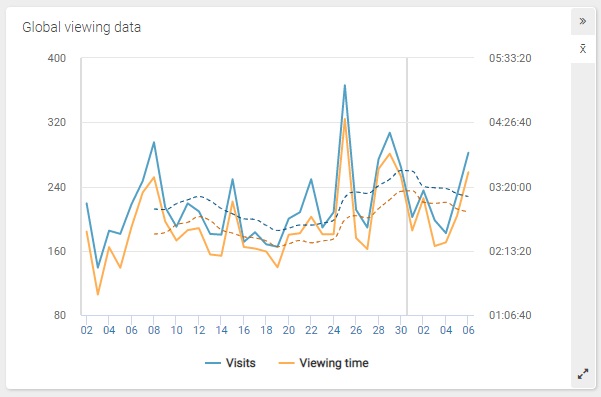
The chart "Global viewing data" shows immediately the viewing trend, the highs and the lows for online videos in the given time period. In detail, the chart shows on the horizontal axis the days or months for the given time period and on the vertical axis the number of views and the viewing time for all the videos listed in the table below.
Blue marks the views, orange the viewing time, given in hours, minutes and seconds (hh:mm:ss).
The chart type can be changed by clicking on the icons on the right, by the title.